Energy production in July 2021 From National Bureau of Statistics
The following is the Energy production in July 2021 From National Bureau of Statistics recommended by recordtrend.com. And this article belongs to the classification: new energy.
seven In January, the year-on-year decline in raw coal production of industries above Designated Size narrowed, crude oil production was basically stable, the growth rate of natural gas production slowed down, and the growth rate of power production accelerated. with two thousand and nineteen year seven June is the base period. The average growth rate of raw coal production in two years decreased, the growth of crude oil production remained stable, and the production of natural gas and electricity increased rapidly.
I. production of raw coal, crude oil and natural gas and related information
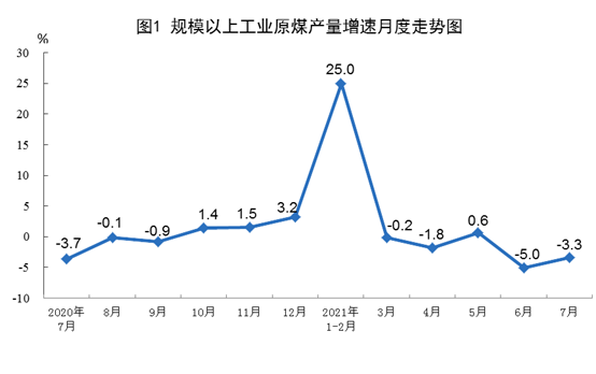
The decline in raw coal production narrowed. seven In January, raw coal was produced three point one Million tons, down year-on-year 3.3%, narrower than the previous month one point seven Percentage point, ratio two thousand and nineteen Year on year decline 6.9%, with an average decline in two years 3.5%, average daily output one thousand and thirteen 10000 tons; Imported coal three thousand and eighteen Million tons, a year-on-year increase 15.6%。
1—7 In January, raw coal was produced twenty-two point six Billion tons, year-on-year increase 4.9%, ratio two thousand and nineteen Year on year growth 4.8%, two-year average growth 2.4%; Imported coal sixteen thousand nine hundred and seventy-four Million tons, down year-on-year 15.0%。
The comprehensive trading price of port coal continued to rise. seven month thirty Qinhuangdao Port five thousand and five hundred Kcal, 5000 Kcal, 4500 The comprehensive transaction prices of large calorie thermal coal are respectively per ton eight hundred and forty-five Yuan, 773 Yuan he six hundred and eighty-six Yuan, ratio six month twenty-five The prices rose on the 1st and the 2nd respectively twenty-six Yuan, 34 Yuan he thirty-eight Yuan.
Crude oil production increased steadily, and processing capacity changed from increase to decrease. seven In January, crude oil was produced one thousand six hundred and eighty-seven Million tons, a year-on-year increase 2.5%, ratio two thousand and nineteen Year on year growth 3.1%, two-year average growth 1.5%, average daily output fifty-four point four 10000 tons; Processing crude oil five thousand nine hundred and six Million tons, down year-on-year 0.9%, ratio two thousand and nineteen Year on year growth 11.4%, two-year average growth 5.6%, average daily processing one hundred and ninety point five Million tons.
1—7 In January, crude oil was produced eleven thousand six hundred and twenty-one Million tons, a year-on-year increase 2.4%, ratio two thousand and nineteen Year on year growth 3.9%, two-year average growth 1.9%; Processing crude oil forty-one thousand two hundred and forty-one Million tons, a year-on-year increase 8.9%, ratio two thousand and nineteen Year on year growth 11.4%, two-year average growth 5.5%。
The decline in crude oil imports narrowed and the international crude oil price fluctuated at a high level. seven In January, imported crude oil four thousand one hundred and twenty-four Million tons, down year-on-year 19.6%; 1—7 In January, imported crude oil thirty thousand one hundred and eighty-three Million tons, down year-on-year 5.6%。 seven month thirty The spot FOB price of Brent crude oil was seventy-seven point seven two dollar / Barrel, ratio six month thirty Diurnal seventy-six point nine four dollar / Barrel rise 1.0%。
The growth rate of natural gas production slowed down. seven In January, natural gas was produced one hundred and fifty-eight Billion cubic meters, a year-on-year increase 9.8%, down from the previous month three point three Percentage point, ratio two thousand and nineteen Year on year growth 15.1%, two-year average growth 7.3%, average daily output five point one Billion cubic meters.
1—7 In January, natural gas was produced one thousand two hundred and two Billion cubic meters, a year-on-year increase 10.7%, ratio two thousand and nineteen Year on year growth 21.2%, with an average growth of two years 10.1%。
Natural gas imports grew rapidly. seven In January, imported natural gas nine hundred and thirty-four Million tons, a year-on-year increase 27.0%。 1—7 In January, imported natural gas six thousand eight hundred and ninety-six Million tons, a year-on-year increase 24.0%。
II. Power production
Power production accelerated. seven Month, power generation seven thousand five hundred and eighty-six Billion kwh, a year-on-year increase 9.6%, faster than the previous month two point two Percentage point, ratio two thousand and nineteen Year on year growth 11.7%, with an average growth of two years 5.7%, average daily power generation two hundred and forty-four point seven Billion kwh. 1—7 Month, power generation forty-six thousand four hundred and fifty Billion kwh, a year-on-year increase 13.2%, ratio two thousand and nineteen Year on year growth 12.2%, two-year average growth 5.9%。
By variety, 7 In January, thermal power, nuclear power and wind power all grew rapidly, the decline of hydropower narrowed, and solar power generation fell slightly. Among them, thermal power increased year-on-year 12.7% to two thousand and nineteen year seven Month is the base period, with an average growth of two years 5.8%; Hydropower decline 4.3%, two-year average growth 0.8%; Nuclear power growth 14.4%, with an average growth of two years 10.5%; Wind power growth 25.4%, two-year average growth 24.3%; Solar power growth 12.1%, two-year average growth 5.5%。
More reading: National Bureau of Statistics: energy production in June 2021 National Bureau of Statistics: energy production in May 2021 National Bureau of Statistics: energy production in March 2021 National Bureau of Statistics: energy production in December 2020 National Bureau of Statistics: energy production in October 2020 National Bureau of Statistics: energy production in May 2020 National Bureau of Statistics: April 2021 National Bureau of statistics of China’s energy production: energy production in April 2020 National Bureau of Statistics: energy production in December 2018 China Bureau of Statistics: energy production in March 2019 National Bureau of Statistics: the added value of industries above designated size increased by 14.1% in March 2021 National Bureau of Statistics: National Statistics of real estate development and investment in the East, central and western regions and Northeast China from January to March 2021 Bureau of Statistics: the added value of national tourism and related industries in 2017 was 3721 billion yuan. National Bureau of Statistics: the retail sales of cosmetics in China in May 2014 was 14.3 billion yuan, a year-on-year increase of 12.9%. National Bureau of Statistics: national real estate development investment and sales from January to June 2021
If you want to get the full report, you can contact us by leaving us the comment. If you think the information here might be helpful to others, please actively share it. If you want others to see your attitude towards this report, please actively comment and discuss it. Please stay tuned to us, we will keep updating as much as possible to record future development trends.
RecordTrend.com is a website that focuses on future technologies, markets and user trends. We are responsible for collecting the latest research data, authority data, industry research and analysis reports. We are committed to becoming a data and report sharing platform for professionals and decision makers. We look forward to working with you to record the development trends of today’s economy, technology, industrial chain and business model.Welcome to follow, comment and bookmark us, and hope to share the future with you, and look forward to your success with our help.


