Operation profile of power industry from January to August 2021 From China electricity Union
The following is the Operation profile of power industry from January to August 2021 From China electricity Union recommended by recordtrend.com. And this article belongs to the classification: Chinese economy.
From January to August, the power consumption of the whole society increased year-on-year, and the growth rate of power consumption slowed down in that month; The installed capacity of power generation continued to grow rapidly, and the monthly power generation of hydropower increased negatively for three consecutive months; In addition to hydropower and solar power generation, the utilization hours of other types of power generation equipment increased year-on-year; The power transmission across regions and provinces increased year-on-year; The new installed capacity of various types of power generation infrastructure increased year-on-year, of which the new installed capacity of renewable energy infrastructure increased more; Investment in power supply and power grid increased year-on-year.
1、 Power consumption of the whole society
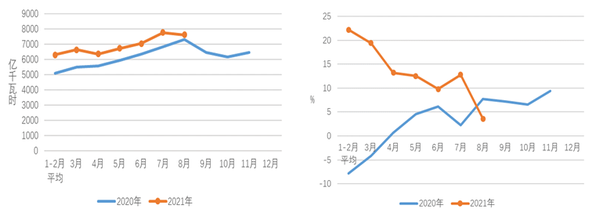
From January to August, the power consumption of the whole society was 5470.4 billion kwh, a year-on-year increase of 13.8%. Among them, the power consumption of the whole society in August was 760.7 billion kwh, a year-on-year increase of 3.6%.
By industry ① from January to August, the power consumption of the primary industry was 66 billion kwh, a year-on-year increase of 19.3%, accounting for 1.2% of the power consumption of the whole society; The electricity consumption of the secondary industry was 3652.9 billion kwh, a year-on-year increase of 13.1%, an increase of 13.6 percentage points over the same period of the previous year, accounting for 66.8% of the electricity consumption of the whole society; The power consumption of the tertiary industry was 953.3 billion kwh, an increase of 21.9% year-on-year, an increase of 22.9 percentage points over the same period last year, accounting for 17.4% of the power consumption of the whole society; The domestic electricity consumption of urban and rural residents was 798.1 billion kwh, an increase of 7.5% year-on-year, an increase of 1.2 percentage points over the same period of last year, accounting for 14.6% of the electricity consumption of the whole society.
Figure 1 Monthly electricity consumption and growth rate of the whole society in 2020 and 2021
From January to August, the national industrial power consumption increased by 13.1% year-on-year, and the growth rate increased by 13.5 percentage points year-on-year. The national manufacturing power consumption increased by 14.9% year-on-year, and the growth rate increased by 15.3 percentage points year-on-year. In the manufacturing industry, the total power consumption of the four high load industries increased by 11.0% year-on-year, of which the building materials industry increased by 14.5%, the black industry increased by 12.6%, the chemical industry increased by 9.9% and the non-ferrous industry increased by 8.2% year-on-year; The total power consumption of high-tech and equipment manufacturing industry increased by 21.7% year-on-year, of which the electrical machinery and equipment manufacturing industry, automobile manufacturing industry, computer / communication and other electronic equipment manufacturing industry, general equipment manufacturing industry and instrument manufacturing industry increased by more than 20% year-on-year, 29.5%, 25.0%, 24.4%, 23.9% and 23.0% respectively; The total power consumption of consumer goods manufacturing industry increased by 18.3% year-on-year, including furniture manufacturing, culture, education / industrial beauty / sports and entertainment products manufacturing, textile and clothing / clothing industry, wood processing and wood / bamboo / rattan / Brown / grass products industry, textile industry, leather / fur / feather and its products and footwear industry, which increased by more than 20% year-on-year, 27.8%, 24.8%, 24.1%, 23.7%, 22.8% and 22.7% respectively.
From January to August, the power consumption of the tertiary industry increased by 21.9% year-on-year. Among them, accommodation and catering, leasing and business services, wholesale and retail, real estate, public services and management organizations all increased by more than 20% year-on-year, 29.4%, 28.2%, 28.1%, 23.3% and 21.7% respectively.
From January to August, the year-on-year growth of power consumption of the whole society in 17 provinces exceeded the national average.
In August, the power consumption of the primary industry was 10.7 billion kwh, a year-on-year increase of 13.7%; The power consumption of the secondary industry was 485.1 billion kwh, a year-on-year increase of 0.6%; The electricity consumption of the tertiary industry was 140 billion kwh, a year-on-year increase of 6.2%; The domestic electricity consumption of urban and rural residents was 124.9 billion kwh, a year-on-year increase of 12.5%.
In August, China’s industrial power consumption increased by 0.6% year-on-year, and the growth rate decreased by 9.3 percentage points year-on-year. The national manufacturing power consumption increased by 4.0% year-on-year, and the growth rate decreased by 5.7 percentage points year-on-year. In the manufacturing industry, the total power consumption of the four high energy carrying industries increased by 1.5% year-on-year, the total power consumption of high-tech and equipment manufacturing industry increased by 5.9% year-on-year, and the total power consumption of consumer goods manufacturing industry increased by 7.3% year-on-year.
In August, the power consumption of the tertiary industry increased by 6.2% year-on-year. Among them, the power consumption of wholesale and retail industry increased by 12.3%, that of leasing and business services increased by 7.8%, and that of accommodation and catering industry increased by 6.2%.
In August, the growth rate of power consumption in 16 provinces exceeded the national average.
2、 Power generation production
By the end of August, China’s installed power generation capacity was 2.28 billion kw, a year-on-year increase of 9.5%. Among them, the installed capacity of non fossil energy was 1.04 billion kw, a year-on-year increase of 18.1%, accounting for 45.6% of the total installed capacity, an increase of 3.3 percentage points year-on-year. Hydropower was 380 million KW, with a year-on-year increase of 4.9%, of which conventional hydropower was 350 million KW, with a year-on-year increase of 4.8%. Thermal power was 1.28 billion kw, with a year-on-year increase of 3.8%, of which coal-fired power generation was 1.09 billion kw, with a year-on-year increase of 2.2%, gas power generation was 106.56 million KW, with a year-on-year increase of 11.8%, and biomass power generation was 34.58 million KW, with a year-on-year increase of 32.3%. 53.26 million kilowatts of nuclear power, a year-on-year increase of 9.2%. Wind power was 300 million kW (of which onshore wind power and offshore wind power were 283.17 and 12.15 million KW respectively), a year-on-year increase of 33.8%. Solar power generation was 280 million kW (of which photovoltaic power generation and photothermal power generation were 27461 and 520000 kW respectively), a year-on-year increase of 24.6%.
By the end of August, the installed capacity of power plants with 6000 kW and above in China was 2.14 billion kw, a year-on-year increase of 9.0%, an increase of 7.78 million KW over the previous month, and the growth rate increased by 3.4 percentage points over the same period of the previous year. 340 million kilowatts of hydropower, including 310 million kilowatts of conventional hydropower; 1.27 billion kilowatts of thermal power, including 1.09 billion kilowatts of coal-fired power generation and 105 million kilowatts of gas-fired power generation; 53.26 million kw of nuclear power; Grid connected wind power 300 million KW; Grid connected solar power generation is 190 million KW.
From January to August, the power generation capacity of power plants above Designated Size in China was 5389.4 billion kwh, a year-on-year increase of 11.3%, and the growth rate increased by 11.0 percentage points over the same period of last year.
From January to August, the hydropower generation capacity of power plants above Designated Size in China was 761.7 billion kwh, a year-on-year decrease of 1.0%, and the growth rate increased by 1.3 percentage points over the same period of last year. The top three provinces of hydropower generation in China are Sichuan (1984 billion KWH), Yunnan (179.2 billion KWH) and Hubei (96.7 billion KWH). Their total hydropower generation accounts for 62.3% of the national hydropower generation, with a year-on-year increase of – 4.6%, 9.3% and – 5.8% respectively.
From January to August, the thermal power generation capacity of power plants above Designated Size in China was 3872.3 billion kwh, a year-on-year increase of 12.6%, and the growth rate was 13.0 percentage points higher than that of the same period last year. In terms of provinces, except Tibet, Jilin and Hebei, which decreased by 13.3%, 3.6% and 1.5% year-on-year, the thermal power generation capacity of other provinces increased year-on-year. Among them, the provinces with a growth rate of more than 30% include Qinghai (36.5%), Sichuan (34.4%) and Guangdong (32.3%).
From January to August, the national nuclear power generation capacity was 269.9 billion kwh, a year-on-year increase of 13.3%, and the growth rate increased by 7.1 percentage points over the same period last year.
From January to August, the power generation of grid connected wind power plants in China was 430.1 billion kwh, a year-on-year increase of 42.0%, and the growth rate increased by 27.8 percentage points over the same period of last year.
3、 Utilization hours of power generation equipment
From January to August, the cumulative average utilization hours of power generation equipment in China were 2560 hours, an increase of 112 hours over the same period of last year.
Figure 2 Utilization of hours from January to August over the years since 2005
From January to August, the average utilization hours of hydropower equipment in China were 2360 hours, a decrease of 78 hours over the same period last year. Among the top 10 provinces with hydropower installed capacity, except Guizhou and Zhejiang, the average utilization hours of hydropower equipment in other provinces decreased year-on-year. Among them, Qinghai, Guangdong and Hubei decreased significantly by 448, 248 and 202 hours respectively; The average utilization hours of thermal power equipment in China were 2988 hours, an increase of 260 hours over the same period of last year. Among them, the average utilization hours of coal-fired power generation equipment were 3089 hours, an increase of 293 hours over the same period of last year, and the average utilization hours of gas-fired power generation equipment were 1849 hours, an increase of 137 hours over the same period of last year. In terms of provinces, the utilization hours of thermal power equipment in 14 provinces in China exceed the national average, including more than 3300 hours in Jiangxi, Inner Mongolia, Gansu and Xinjiang, 3544, 3361, 3337 and 3325 hours respectively, more than 3000 hours in Fujian, Guangxi, Hainan, Zhejiang, Anhui, Jiangsu, Shaanxi, Guangdong, Ningxia and Shandong, while only 202 hours in Tibet. Compared with the same period of last year, the utilization hours of thermal power in other provinces except Jilin, Heilongjiang, Inner Mongolia, Hebei and Liaoning increased year-on-year, of which Sichuan, Chongqing, Zhejiang, Guangdong, Qinghai and Hubei increased by more than 500 hours, 740, 730, 642, 611, 587 and 538 hours respectively; The average utilization hours of nuclear power equipment in China were 5219 hours, an increase of 338 hours over the same period of last year; The average utilization hours of grid connected wind power equipment in China were 1500 hours, an increase of 83 hours over the same period of last year; The average utilization hours of solar power generation equipment in China were 896 hours, a decrease of 1 hour over the same period of last year.
Figure 3 From January to August, there are many wind power installed capacity and equipment utilization hours in provinces with large wind power installed capacity
4、 Power transmission across regions and provinces across the country
From January to August, 449.2 billion kwh of cross regional power transmission was completed, a year-on-year increase of 8.3%. Among them, North China sent 3.5 billion kwh to central China (UHV), a year-on-year increase of 13.5%; North China sent 45.7 billion kwh to East China, a year-on-year increase of 30.2%; Northeast China sent 35.7 billion kwh to North China, a year-on-year decrease of 13.0%; Central China sent 23.9 billion kwh to East China, a year-on-year decrease of 10.3%; Central China sent 16.6 billion kwh to the south, a year-on-year decrease of 10.2%; Northwest China sent 131.9 billion kwh to North and central China, a year-on-year increase of 17.4%; The southwest sent 50.6 billion kwh to East China, a year-on-year decrease of 16.4%.
From January to August, the total power transmitted by all provinces in China was 1062.9 billion kwh, a year-on-year increase of 9.0%. Among them, the power delivered by Inner Mongolia was 164.1 billion kwh, a year-on-year increase of 21.4%; Yunnan delivered 98.4 billion kwh, a year-on-year decrease of 3.1%; Shanxi delivered 84.8 billion kwh, a year-on-year increase of 21.8%; Xinjiang delivered 78.5 billion kwh of electricity, an increase of 25.2% year-on-year; Sichuan delivered 75.5 billion kwh, a year-on-year decrease of 11.6%; Ningxia sent 72 billion kwh of electricity, a year-on-year decrease of 1.0%.
In August, 74.7 billion kwh of cross regional power transmission was completed, a year-on-year decrease of 3.3%. Among them, North China sent 7 billion kwh to East China, a year-on-year increase of 9.6%; Northeast China sent 7.2 billion kwh to North China, a year-on-year decrease of 1.2%; Central China sent 5 billion kwh to East China, a year-on-year decrease of 20.8%; Central China sent 2.8 billion kwh to the south, a year-on-year decrease of 10.8%; Northwest China sent 19.2 billion kwh to North and central China, a year-on-year increase of 4.2%; Southwest China sent 12.7 billion kwh to East China, a year-on-year decrease of 15.5%.
In August, the total electricity transmitted by all provinces in China was 167.5 billion kwh, a year-on-year decrease of 2.5%. Among them, Yunnan delivered 24.1 billion kwh, a year-on-year decrease of 7.4%; Inner Mongolia delivered 23.9 billion kwh, a year-on-year increase of 13.5%; Sichuan’s electricity output was 20.5 billion kwh, a year-on-year decrease of 1.7%; Shanxi delivered 13.2 billion kwh, a year-on-year increase of 17.1%; Xinjiang delivered 11.9 billion kwh, a year-on-year increase of 7.2%.
5、 New installed capacity
From January to August, the national infrastructure added 81.96 million kilowatts of power generation capacity, 20.24 million kilowatts more than the same period last year. Among them, 12.73 million kilowatts of hydropower, 28.94 million kilowatts of thermal power (including 16.7 million kilowatts of coal, 5.19 million kilowatts of gas and 4.67 million kilowatts of biomass), 3.4 million kilowatts of nuclear power, 14.63 million kilowatts of wind power and 22.05 million kilowatts of solar power generation, and 473, 62, 340, 459 and 6.88 million kilowatts of hydropower, thermal power, nuclear power, wind power and solar power were put into operation respectively over the same period of the previous year.
6、 Completion of power investment
From January to August, the investment in power supply projects of major power generation enterprises in China was 270.4 billion yuan, a year-on-year increase of 5.8%. Among them, hydropower was 62.3 billion yuan, a year-on-year increase of 12.8%; Thermal power was 30 billion yuan, a year-on-year increase of 12.4%; Nuclear power was 30.5 billion yuan, a year-on-year increase of 50.6%; Wind power was 123.5 billion yuan, a year-on-year decrease of 7.1%. The investment in clean energy such as hydropower, nuclear power and wind power accounted for 91.2% of the investment in power supply, a year-on-year decrease of 1.3%.
From January to August, the national power grid project completed an investment of 240.9 billion yuan, a year-on-year increase of 1.3%.
Note:
① Since May 2018, the division of three industries has been adjusted in accordance with the notice of the National Bureau of statistics on Revising the provisions on the division of three industries (2012) (gtsgh [2018] No. 74). In order to ensure the comparability of data, the data in the same period have been reclassified according to the new standards.
② The statistical caliber of newly added thermal power installed capacity this year includes emergency peak shaving reserve power supply. More reading: China Power Council: annual development of China’s power industry in 2021 China Power Council: transaction profile of the national power market from January to August 2021 people’s Bank of China: questionnaire survey report of urban depositors in the first quarter of 2019 sharing opportunities: impact of China International Import Expo on the commercial real estate market (download attached) China Bureau of Statistics: the profits of Industrial Enterprises above designated size increased by 16.2% from January to August 2018. Ministry of Commerce: the national absorption of foreign capital in 2017. People’s Bank of China: the implementation report of China’s monetary policy in Q1 2018 (attached) National Bureau of Statistics: in August 2020, China’s total retail sales of social consumer goods reached 3357.1 billion yuan, a year-on-year increase of 0.5%. National Bureau of Statistics: main data of total retail sales of social consumer goods in May 2020. National Bureau of Statistics: in April 2020, the total retail sales of social consumer goods decreased by 7.5%. National Bureau of Statistics: from January to October 2019, the country completed fixed asset investment (excluding farmers) 51088 billion yuan, with a year-on-year increase of 5.2%. China Bureau of Statistics: the total retail sales of social consumer goods increased by 7.5% in August 2019. National Bureau of Statistics: household income and consumer expenditure in the first quarter of 2021. State Post Office: operation data of postal industry in November 2020. Shell Research Institute: Housing rental report from 2019 to 2020
If you want to get the full report, you can contact us by leaving us the comment. If you think the information here might be helpful to others, please actively share it. If you want others to see your attitude towards this report, please actively comment and discuss it. Please stay tuned to us, we will keep updating as much as possible to record future development trends.
RecordTrend.com is a website that focuses on future technologies, markets and user trends. We are responsible for collecting the latest research data, authority data, industry research and analysis reports. We are committed to becoming a data and report sharing platform for professionals and decision makers. We look forward to working with you to record the development trends of today’s economy, technology, industrial chain and business model.Welcome to follow, comment and bookmark us, and hope to share the future with you, and look forward to your success with our help.


