China dairy trade monthly report in June 2021 From Dairy economic observation
The following is the China dairy trade monthly report in June 2021 From Dairy economic observation recommended by recordtrend.com. And this article belongs to the classification: Life data.
01. Overview of dairy trade
Overview of dairy trade
1.1.1 From January to may, imported dry dairy products + 30% to 1.3 million tons, liquid dairy products + 58% to 560000 tons
Notes: 1. Due to the increase of cream imports year by year, cream will be classified separately from packaged milk in the report from 2021.
2. As the import volume of milk protein is increasing year by year, according to the opinions of the customs and food administration, the two tax numbers of milk protein (3501135022) will be classified as dairy products in 2021.
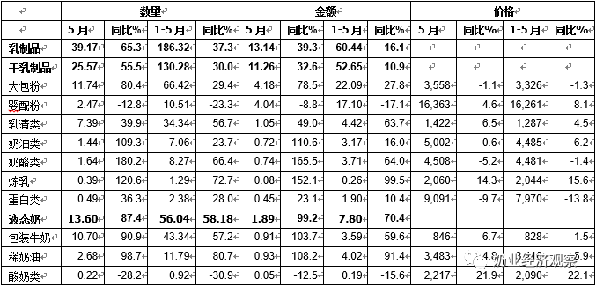
From January to may 2021, China imported 1.8632 million tons of various dairy products, a year-on-year increase of + 37.3%, and the import volume was USD 6.044 billion, a year-on-year increase of + 16.1%. Equivalent to 10.98 million tons of fresh milk, year-on-year + 31% (dry products are converted by 1:8, liquid dairy products by 1:1, the same below).
Among them, dry dairy products were 1302800 tons, a year-on-year increase of + 30%, the import value was US $5.265 billion, a year-on-year increase of + 10.9%, liquid milk was 560400 tons, a year-on-year increase of + 58.2%, and the import value was US $780 million, a year-on-year increase of + 70.4%.
In terms of the main categories of imports, except for infant formula milk powder and yogurt, other categories have increased by different ranges, especially cream, packaged milk, whey, condensed milk, cheese and large package powder:
Big bag powder The import volume was 664200 tons, a year-on-year increase of + 29.4%, the import volume was US $2.21 billion, a year-on-year increase of + 27.8%, the average price was US $3326 / ton, a year-on-year increase of – 1.3%, mainly from New Zealand, accounting for 79.2%, the European Union, accounting for 7.7%, and Australia, accounting for 6.6%.
Baby powder The import volume was 105100 tons, a year-on-year increase of – 23.3%, the import volume was USD 1.71 billion, a year-on-year increase of – 17.1%, the average price was USD 16261 / ton, a year-on-year increase of + 8.1%, mainly from the European Union, accounting for 68.8% and New Zealand, accounting for 23.5%.
milk Cheese The import was 82700 tons, a year-on-year increase of + 66.4%, the import volume was 370 million US dollars, a year-on-year increase of + 64%, the average price was 4481 US dollars / ton, a year-on-year increase of – 1.4%, mainly from New Zealand, accounting for 59.6%, the European Union, 19.3%, Australia, 14.2% and the United States, accounting for 4.1%.
Milk oil The import volume was 70600 tons, a year-on-year increase of + 23.7%, the import volume was 317 million yuan, a year-on-year increase of + 16%, and the average price was 4485 US dollars / ton, a year-on-year increase of – 6.2%. It is mainly from New Zealand, accounting for 84%, the EU for 11.4% and Australia for 4%.
milk clear The import volume was 343400 tons, a year-on-year increase of + 56.7%, the import volume was 442 million yuan, a year-on-year increase of + 63.7%, and the average price was 1287 US dollars / ton, a year-on-year increase of + 4.5%. Mainly from the European Union, accounting for 37.2%, the United States, accounting for 37.1%, Belarus, accounting for 9.9% and Turkey, accounting for 6.6%.
Refine Milk The import was 12900 tons, a year-on-year increase of + 72.7%, the import volume was 26 million yuan, a year-on-year increase of + 99.5%, and the average price was 2044 US dollars / ton, a year-on-year increase of + 15.6%. It mainly comes from the European Union, accounting for 68.5%, Australia for 24.6% and Malaysia for 4.4%.
Proteins The import volume was 23800 tons, a year-on-year increase of + 28%, the import volume was 190 million yuan, a year-on-year increase of + 10.4%, and the average price was 7970 US dollars / ton, a year-on-year increase of – 13.8%. It mainly comes from New Zealand, accounting for 38.4%, the European Union 31.9% and the United States 23.6%.
Milk packaging The import was 433400 tons, a year-on-year increase of + 57.2%, the import volume was 359 million yuan, a year-on-year increase of + 59.6%, and the average price was 828 US dollars / ton, a year-on-year increase of + 1.5%. It mainly comes from the European Union, accounting for 62.5%, New Zealand, 24.3% and Australia, 11.3%.
acid milk The import was 9200 tons, a year-on-year increase of – 30.9%, the import volume was 19 million yuan, a year-on-year increase of – 15.6%, and the average price was 2090 US dollars / ton, a year-on-year increase of + 22.1%. Mainly from the EU, accounting for 83.7% and New Zealand, accounting for 11.4%.
Cream The import was 117900 tons, a year-on-year increase of + 80.7%, the import volume was 402 million yuan, a year-on-year increase of + 91.4%, and the average price was 3410 US dollars / ton, a year-on-year increase of + 5.9%. It mainly comes from New Zealand, accounting for 52.3%, the EU for 41.2% and the UK for 4.7%.
In May 2021, China imported 391700 tons of all kinds of dairy products, a year-on-year increase of + 65.3%, and the import volume was US $1.314 billion, a year-on-year increase of + 39.3%, equivalent to 2.18 million tons of fresh milk, a year-on-year increase of + 57% (dry products are converted by 1:8 and liquid milk by 1:1).
Among them, 255700 tons of dry dairy products were imported, with a year-on-year increase of 55.5%, and the import value was US $1.126 billion, with a year-on-year increase of 32.6%. The main three categories of products were: 117400 tons of large package powder, accounting for 45.9%, 73900 tons of whey, accounting for 28.9%, and 24700 tons of infant powder, accounting for 9.7%; The import of liquid milk was 136000 tons, a year-on-year increase of 87.4%, and the import volume was 189 million US dollars, a year-on-year increase of 99.2%.
Table 1‑1 China’s dairy imports 2021-2021
Unit: 10000 tons, USD 100 million,%
1.1.2 From January to may, China exported 17800 tons of various dairy products, a year-on-year increase of + 4.7%
The export volume of China’s dairy products is very small. For many years, the main export product has been the fresh milk supplied to Guangdong from Hong Kong. In recent years, the export has decreased year by year. Infant formula powder has become the main export product, and the main destination is also Hong Kong.
From January to may 2021, China exported 17766 tons of various dairy products, with a year-on-year increase of 4.7%, and the export volume was USD 111.9466 million, with a year-on-year increase of 18.1%; In May, China exported 3751.69 tons of various dairy products, a year-on-year increase of 8.7%, and the export volume was US $26.1072 million, a year-on-year increase of 58.4%.
Dry dairy products From January to may 2021, 6166.51 tons of dry dairy products were exported, with a year-on-year increase of 8.1%, and the export volume was US $98.4833 million, with a year-on-year increase of 19.2%; In May, 1386.89 tons of dry dairy products were exported, with a year-on-year increase of 54.1%, and the export volume was USD 23.3165 million, with a year-on-year increase of 68.6%.
Liquid milk From January to may 2021, 11599.5 tons of liquid milk were exported, with a year-on-year increase of 3%, and the export volume was US $13.4633 million, with a year-on-year increase of 10.5%; 2364.8 tons of liquid milk were exported, a year-on-year decrease of 7.3%, and the export volume was USD 2.7907 million, a year-on-year increase of 5.5%.
Forage and feed raw materials
1.2.1 Hay import from January to may + 1.3% to 656800 tons
According to customs statistics, from January to may 2021, China imported 656800 tons of hay, a year-on-year increase of + 1.3%, and the import volume was US $232 million, a year-on-year increase of – 1.1%.
Alfalfa hay: from January to may 2021, 535500 tons of alfalfa hay were imported, with a year-on-year increase of + 8.8%. The import amount was USD 191791300, with a year-on-year increase of + 7.1%. The average CIF price was USD 358.17/ton, with a year-on-year increase of – 1.5%.
Among them, 470000 tons mainly came from the United States, accounting for 87.8%, year-on-year + 8.6%; The average CIF price was USD 364.51/t, a year-on-year increase of – 1.7%. 30700 tons of dehydrated alfalfa were imported from Spain, accounting for 5.7%, year-on-year – 14%; The average CIF price was US $288.94/t, a year-on-year increase of – 1.7%. Canada, South Africa, Sudan and Lithuania maintain small imports.
Oat hay: from January to may 2021, China imported 121400 tons of oat hay, a year-on-year increase of – 22.2%, the import amount was USD 39.7169 million, a year-on-year increase of – 27.7%, and the average CIF price was USD 327.28/ton, a year-on-year increase of – 7.1%. Oat hay is imported from Australia.
02. Dairy raw material Trade
Dairy import
2.1.1 Dry dairy products imported 1.3028 million tons from January to may, with a year-on-year increase of 30%
From January to may 2021, 1.3028 million tons of dry dairy products were imported, with a year-on-year increase of 30%, and the import volume was US $5.265 billion, with a year-on-year increase of 10.9%. The main three categories of products include 664200 tons of large package powder, accounting for 51%, 343400 tons of whey, accounting for 26.4%, and 105100 tons of infant powder, accounting for 8.1%.
In May, 255700 tons of dry dairy products were imported, with a year-on-year increase of 55.5%. The import volume was US $1.126 billion, with a year-on-year increase of 32.6%. The main three categories of products were: 117400 tons of large package powder, accounting for 45.9%, 73900 tons of whey, accounting for 28.9%, and 24700 tons of infant powder, accounting for 9.7%
2.1.2 From January to may, the import of large package powder + 29.4% to 664200 tons, with a year-on-year price of – 1.3%
According to the statistics of China Customs, from January to may 2021, China imported 664200 tons of packaged powder, a year-on-year increase of 29.4%, the import volume was US $2.209 billion, a year-on-year increase of 27.8%, and the average price was US $3326 / ton, a year-on-year decrease of 1.3%.
Among them, 526000 tons were imported from New Zealand, accounting for 79.2%, a year-on-year increase of 23.1%, 51400 tons from the EU, accounting for 7.7%, a year-on-year increase of 27%, 43600 tons from Australia, accounting for 6.6%, a year-on-year increase of 67.8%.
In May, China imported 117400 tons of packaged powder, a year-on-year increase of 80.4%, the import volume was 418 million US dollars, a year-on-year increase of 78.5%, and the average price was 3558 US dollars / ton, a year-on-year decrease of 1.1%.
Among them, 79200 tons were imported from New Zealand, accounting for 67.5%, a year-on-year increase of 62.6%, 14000 tons were imported from the EU, accounting for 11.9%, a year-on-year increase of 93.3%, and 13800 tons were imported from Australia, accounting for 11.7%, a year-on-year increase of 112.1%.
Table 2 ‑ 1 changes in China’s large bag powder import 2018-2021
Unit: 10000 tons, USD 100 million, USD / ton
Table 2 ‑ 2 sources of China’s large bag powder imports 2021
Unit: 10000 tons,%
Note: in two thousand and twenty-one The cumulative number in the current year is ranked as the proportion in the total import volume of the country. Figure 2 ‑ 1 China’s monthly import of large bag powder 2020-2021
2.1.3 Whey imports from January to may + 56.7% to 343000 tons, with a year-on-year price of + 4.5%
According to the statistics of China Customs, from January to may 2021, China imported 343400 tons of whey, a year-on-year increase of 56.7%, the import volume was US $442 million, a year-on-year increase of 63.7%, and the average price was US $1287 / ton, a year-on-year increase of 4.5%.
Among them, 127800 tons were imported from the EU, accounting for 37.2%, a year-on-year increase of 41.4%, 127500 tons from the United States, accounting for 37.1%, a year-on-year increase of 40%, 34000 tons from Belarus, accounting for 9.9%, a year-on-year increase of 81.2%, and 10300 tons from Argentina, accounting for 3%, a year-on-year increase of 59.6%.
In May, China imported 73900 tons of whey, with a year-on-year increase of 39.9%. The import volume was US $105 million, with a year-on-year increase of 49%. The average price was US $1422 / ton, with a year-on-year increase of 6.5%.
Among them, 31800 tons were imported from the EU, accounting for 43.1%, a year-on-year increase of 32.5%, 25200 tons were imported from the United States, accounting for 34.2%, a year-on-year increase of 33.7%, and 6800 tons were imported from Belarus, accounting for 9.2%, a year-on-year increase of 28.6%.
Table 2 ‑ 3 China’s whey imports 2021
Unit: 10000 tons,%
Figure 2 ‑ 2 monthly import of whey in China 2019-2021
2.1.4 Cheese imports from January to may + 66.4% to 82700 tons, with a year-on-year price of – 1.4%
According to the statistics of China Customs, from January to may 2021, China imported 82700 tons of cheese, a year-on-year increase of 66.4%, the import volume was USD 371 million, a year-on-year increase of 64%, and the average price was USD 4481 / ton, a year-on-year decrease of 1.4%.
Among them, 49300 tons were imported from New Zealand, accounting for 59.6%, with a year-on-year increase of 58.5%; 16000 tons were imported from the EU, accounting for 19.3%, with a year-on-year increase of 121.4%; 11700 tons were imported from Australia, accounting for 14.2%, with a year-on-year increase of 57.6%; 3400 tons were imported from the United States, accounting for 4.1%, with a year-on-year increase of 42.4%.
In May, China imported 16400 tons of cheese, a year-on-year increase of 180.2%, the import volume was US $74 million, a year-on-year increase of 165.5%, and the average price was US $4508 / ton, a year-on-year decrease of 5.2%.
Among them, 8400 tons were imported from New Zealand, accounting for 51.1%, with a year-on-year increase of 336.6%; 4000 tons were imported from the EU, accounting for 24.2%, with a year-on-year increase of 206.4%; 2800 tons were imported from Australia, accounting for 17.1%, with a year-on-year increase of 59%; 0800 tons were imported from the United States, accounting for 4.9%, with a year-on-year increase of 54.3%.
Figure 2 ‑ 3 monthly import of Chinese cheese 2019-2021
2.1.5 cream imports from January to may + 23.7% to 70600 tons, with year-on-year prices of – 6.2%
According to the statistics of China Customs, from January to may 2021, China imported 70600 tons of cream, a year-on-year increase of 23.7%, the import volume was US $317 million, a year-on-year increase of 16%, and the average price was US $4485 / ton, a year-on-year decrease of 6.2%.
Among them, 59300 tons were imported from New Zealand, accounting for 84%, a year-on-year increase of 13.3%, 8000 tons were imported from the EU, accounting for 11.4%, a year-on-year increase of 98.9%, and 2800 tons were imported from Australia, accounting for 4%, a year-on-year increase of 747.5%.
In May, China imported 14400 tons of cream, a year-on-year increase of 109.3%, the import volume was US $72 million, a year-on-year increase of 110.6%, and the average price was US $5002 / ton, a year-on-year increase of 0.6%.
Among them, 11400 tons were imported from New Zealand, accounting for 79%, a year-on-year increase of 95.7%, and 24000 tons were imported from the EU, accounting for 16.4%, a year-on-year increase of 143.2%.
Figure 2 ‑ 4 China’s monthly cream import 2020-2021
Dairy export
The export volume of China’s dairy products is very small. For many years, the main export product has been the fresh milk supplied to Guangdong from Hong Kong. In recent years, the export has decreased year by year. Infant formula powder has become the main export product, and the main destination is also Hong Kong.
From January to may 2021, China exported 17766.02 tons of various dairy products, with a year-on-year increase of 4.7%, and the export volume was USD 111.9466 million, with a year-on-year increase of 18.1%; In May, China exported 3751.69 tons of various dairy products, a year-on-year increase of 8.7%, and the export volume was US $26.1072 million, a year-on-year increase of 58.4%.
2.2.1 Dry dairy products exported 6166.51 tons from January to may, with a year-on-year increase of 8.1%
From January to may 2021, 6166.51 tons of dry dairy products were exported, with a year-on-year increase of 8.1%. The export volume was US $98.4833 million, with a year-on-year increase of 19.2%. The average price was US $15971 / ton, with a year-on-year increase of 10.3%.
Among the export destinations, Hong Kong 4092.57 tons, accounting for 66.4%, with a year-on-year decrease of 1%, exported to the Philippines 500.58 tons, accounting for 8.1%, with a year-on-year increase of 595.3%, and exported to Macao 292.64 tons, accounting for 4.7%, with a year-on-year increase of 62.3%.
There are three main categories: 3109.27 tons of infant powder, accounting for 50.4%, 824.34 tons of large bag powder, accounting for 13.4%, and 732.72 tons of condensed milk, accounting for 11.9%.
Including infant formula:
According to the statistics of China Customs, from January to may 2021, China exported 3109.27 tons of infant powder, a year-on-year decrease of 1.6%, the export volume was US $87 million, a year-on-year increase of 17.9%, and the average price was US $28094 / ton, a year-on-year increase of 19.7%.
Among them, 2721.15 tons were exported to Hong Kong, accounting for 87.5%, a year-on-year decrease of 3.8%, and 292.64 tons were exported to Macao, accounting for 9.4%, a year-on-year increase of 66.2%.
Figure 2 ‑ 5 China’s monthly export of infant formula milk powder 2020-2021
2.2.2 Liquid milk export from January to may + 3% to 11560 tons, with a year-on-year price of + 7.3%
According to the statistics of China Customs, from January to may 2021, China exported 11599.5 tons of liquid milk, a year-on-year increase of 3%, the export volume was US $13 million, a year-on-year increase of 10.5%, and the average price was US $1161 / ton, a year-on-year increase of 7.3%.
Among them, 10539.33 tons were exported to Hong Kong, accounting for 90.9%, a year-on-year increase of 3%, and 476.55 tons were exported to Singapore, accounting for 4.1%, a year-on-year decrease of 20%.
From January to may 2021, China exported 9636.96 tons of packaged milk (fresh milk), an increase of 2.2% year-on-year, accounting for 83% of the total export volume of liquid milk.
Figure 2 ‑ 6 China’s monthly fresh milk export 2020-2021
03. Consumer dairy trade
Import of consumer dairy products
3.1.1 Infant powder imported from January to may – 23.3% to 105100 tons, with a year-on-year price of + 8.1%
According to the statistics of China Customs, from January to may 2021, China imported 105100 tons of infant powder, a year-on-year decrease of 23.3%, the import volume was US $1.71 billion, a year-on-year decrease of 17.1%, and the average price was US $16261 / ton, a year-on-year increase of 8.1%.
Among them, 72300 tons were imported from the EU, accounting for 68.8%, a year-on-year decrease of 24.3%, and 24700 tons were imported from New Zealand, accounting for 23.5%, a year-on-year decrease of 16.2%.
In May, China imported 24700 tons of infant powder, a year-on-year decrease of 12.8%. The import volume was US $404 million, a year-on-year decrease of 8.8%, and the average price was US $16363 / ton, a year-on-year increase of 4.6%.
Among them, 17000 tons were imported from the EU, accounting for 68.8%, a year-on-year decrease of 9.8%, 5400 tons were imported from New Zealand, accounting for 21.9%, a year-on-year decrease of 19.9%, and 0800 tons were imported from Australia, accounting for 3.3%, a year-on-year decrease of 37.3%.
Figure 3 ‑ 1 monthly import volume and price of infant formula milk powder in China 2020-2021
Figure 3 ‑ 2 source countries and proportion of China’s infant formula imports 2021.1-5
Unit: 10000 tons
Figure 3 ‑ 3 changes in China’s infant formula imports and source countries 2009-2020
3.1.2 Packaged milk imported from January to may + 57.2% to 433400 tons, with a year-on-year price of + 1.5%
According to the statistics of China Customs, from January to may 2021, China imported 433400 tons of packaged milk, a year-on-year increase of 57.2%, the import volume was 359 million US dollars, a year-on-year increase of 59.6%, and the average price was 828 US dollars / ton, a year-on-year increase of 1.5%.
Among them, 271000 tons were imported from the EU, accounting for 62.5%, a year-on-year increase of 59.9%, 105500 tons were imported from New Zealand, accounting for 24.3%, a year-on-year increase of 49.4%, and 48800 tons were imported from Australia, accounting for 11.3%, a year-on-year increase of 65.5%.
In May, China imported 107000 tons of packaged milk, a year-on-year increase of 90.9%. The import volume was US $91 million, a year-on-year increase of 103.7%, and the average price was US $846 / ton, a year-on-year increase of 6.7%.
Among them, 68300 tons were imported from the EU, accounting for 63.8%, a year-on-year increase of 101.2%, 26100 tons were imported from New Zealand, accounting for 24.4%, a year-on-year increase of 87.3%, and 9900 tons were imported from Australia, accounting for 9.3%, a year-on-year increase of 43.4%.
Table 3 ‑ 1 packaged milk imported from China 2021.1-5
Unit: 10000 tons
Figure 3 ‑ 4 monthly import volume of packaged milk 2020-2021
3.1.3 Cream import from January to may + 80.7% to 117900 tons, with a year-on-year price of + 5.9%
According to the statistics of China Customs, from January to may 2021, China imported 117900 tons of cream, a year-on-year increase of 80.7%, the import volume was US $402 million, a year-on-year increase of 91.4%, and the average price was US $3410 / ton, a year-on-year increase of 5.9%.
Among them, 61600 tons were imported from New Zealand, accounting for 52.3%, a year-on-year increase of 49.4%, 48600 tons were imported from the EU, accounting for 41.2%, a year-on-year increase of 146.2%, and 5600 tons were imported from the UK, accounting for 4.7%, a year-on-year increase of 63.5%.
In May, China imported 26800 tons of cream, a year-on-year increase of 98.7%, the import volume was US $93 million, a year-on-year increase of 108.2%, and the average price was US $3483 / ton, a year-on-year increase of 4.8%.
Among them, 12900 tons were imported from the EU, accounting for 48.2%, a year-on-year increase of 177.4%, 12200 tons were imported from New Zealand, accounting for 45.5%, a year-on-year increase of 46.9%, and 13000 tons were imported from the UK, accounting for 4.8%, a year-on-year increase of 274.6%.
Figure 3 ‑ 5 monthly import volume of cream 2020-2021
3.1.4 Yogurt imports from January to may – 30.9% to 9200 tons, with a year-on-year price of + 22.1%
According to the statistics of China Customs, from January to may 2021, China imported 9200 tons of yogurt, a year-on-year decrease of 30.9%, the import volume was 19 million US dollars, a year-on-year decrease of 15.6%, and the average price was 2090 US dollars / ton, a year-on-year increase of 22.1%.
Among them, 7700 tons were imported from the EU, accounting for 83.7%, a year-on-year decrease of 32.3%, 1000 tons were imported from New Zealand, accounting for 11.4%, a year-on-year decrease of 33%, and 03000 tons were imported from Australia, accounting for 3.1%, a year-on-year increase of 91.6%.
In May, China imported 2200 tons of yogurt, a year-on-year decrease of 28.2%, the import volume was US $05 million, a year-on-year decrease of 12.5%, and the average price was US $2217 / ton, a year-on-year increase of 21.9%.
Among them, 18000 tons were imported from the EU, accounting for 83.8%, a year-on-year decrease of 26.3%, and 0200 tons were imported from New Zealand, accounting for 11.1%, a year-on-year decrease of 45%.
04. Genetic material Trade
Breeding cattle import
4.1.1 Live cattle imported from January to may + 40.6% to 162100
According to China’s customs data, from January to may 2021, China imported 162100 live cattle (only domestic cattle, excluding buffalo and other cattle), a year-on-year increase of + 40.6%, including 54900 from New Zealand, 49500 from Australia, 43200 from Uruguay, 12500 from Chile and 2000 from Laos.
Among them, only 23900 breeding cattle were classified by the customs, with a year-on-year increase of – 29.5%, including 10300 from New Zealand, 8600 from Australia, 3600 from Uruguay and 1500 from Chile.
In May, 39200 live cattle were imported, with a year-on-year increase of – 5.3%, including 16500 from New Zealand, 8700 from Australia, 13100 from Uruguay, 10000 from Chile and 1000 from Laos.
Among the live cattle imported in May, the breeding cattle counted by the Customs was 4900, a year-on-year increase of – 63.2%, including 11000 from New Zealand and 3800 from Australia.
Figure 4 ‑ 1 China’s live cattle (monthly) import 2020-2021
Company: head
Frozen bovine semen import
4.2.1 Import volume of frozen beef concentrate from January to may + 57% to US $31.27 million
There is no statistics on the import quantity of Bovine Frozen Semen according to the customs data. In terms of amount, the import volume from January to may 2021 reached US $31.27 million, a year-on-year increase of 56%. The source country is mainly the United States, accounting for 90.3%; Germany accounts for 4%; Australia accounts for 2.4%; Britain accounts for 1.7%; Norway accounts for 0.7%; Italy accounts for 0.5%.
05
Forage and feed raw materials
Hay import
According to customs statistics, from January to may, China imported 656800 tons of hay, a year-on-year increase of 1.3%, and the average CIF price was 352.46 US dollars / ton, a year-on-year decrease of 2.3%.
Alfalfa hay: from January to may, China imported 535500 tons of alfalfa hay, a year-on-year increase of 8.8%, the import amount was USD 191791300, a year-on-year increase of 7.1%, and the average CIF price was USD 358.17/ton, a year-on-year decrease of 1.5%.
Oat hay: 1. Imported oat hay totaled 121400 tons, a year-on-year decrease of – 22.2%. The import amount was US $39.7169 million, a year-on-year decrease of 27.7%. The average CIF price was US $327.28/ton, a year-on-year decrease of 7.1%.
According to customs statistics, in May, imported hay was 126600 tons, a year-on-year decrease of 15.9%, and the average CIF price was US $363.0/ton, up 2.5% month on month and 0.7% year-on-year.
Alfalfa hay: imported 118100 tons of alfalfa hay, with a year-on-year decrease of 1.8%, and the amount was US $43.1253 million, with a year-on-year decrease of 1.1%; The average CIF price was USD 365.2/t, up 2.4% month on month and 0.7% year-on-year.
Oat hay: 850000 tons of imported oat hay, a year-on-year decrease of 71.9%, and the amount was USD 2.8247 million, a year-on-year decrease of 73.5%; The average CIF price was USD 332.7/t, up 2.5% month on month and down 5.6% year-on-year.
5.1.1 Imported alfalfa: from January to may + 8.8% to 535500 tons, with a year-on-year price of – 1.5%
According to customs statistics, 535500 tons of alfalfa were imported from January to may 2021, with a year-on-year increase of + 8.8%. The import amount was USD 191791300, with a year-on-year increase of + 7.1%. The average CIF price was USD 358.17/ton, with a year-on-year increase of – 1.5%.
From the perspective of import source countries, 470000 tons mainly came from the United States, accounting for 87.8%, year-on-year + 8.6%; The average CIF price was USD 364.51/t, a year-on-year increase of – 1.7%. 30700 tons of dehydrated alfalfa were imported from Spain, accounting for 5.7%, year-on-year – 14%; The average CIF price was US $288.94/t, a year-on-year increase of – 1.7%. Canada, South Africa, Sudan and Lithuania maintain small imports.
Figure 5‑1 Distribution of source countries of imported alfalfa from January to may 2021
118000 tons of alfalfa hay were imported in may – 1.8% and 83.5% from the United States
In May, China imported 118100 tons of alfalfa hay, a year-on-year increase of – 1.8%, and the amount was USD 43.1253 million, a year-on-year increase of – 1.1%; The average CIF price is USD 365.2/t, with a chain comparison of + 2.4% and a year-on-year comparison of + 0.7%.
98600 tons were mainly from the United States, accounting for 83.5%, year-on-year – 8.6%; The import amount was USD 36.748 million, year-on-year – 7.7%, and the average CIF price was USD 372.78/t, year-on-year + 1%. 9000t dehydrated alfalfa was imported from Spain, accounting for 7.6%, year-on-year + 10.2%; The import amount was USD 2.6907 million, a year-on-year increase of + 14.6%, and the average CIF price was USD 298.68/t, a year-on-year increase of + 4%.
In May, it imported a small amount from Canada, South Africa, Lithuania and Britain. Canada 6500 tons, accounting for 5.5%, year-on-year + 160.1%; The import amount was USD 2151500, a year-on-year increase of + 151.8%, and the average CIF price was USD 332.94/t, a year-on-year increase of – 3.2%. South Africa 2100 tons, accounting for 1.8%, year-on-year + 70.8%; The import amount was USD 696500, a year-on-year increase of + 70.4%, and the average CIF price was USD 329.71/t, a year-on-year increase of – 0.2%.
Figure 5‑2 Alfalfa imports in China 2020-2021
Unit: 10000 tons, USD / ton
5.1.2 Imported oat grass: 121400 tons from January to may – 22.2%, average price – 7.1%
According to customs statistics, from January to may 2021, China imported 121400 tons of oat hay, a year-on-year increase of – 22.2%, the import amount was US $39.7169 million, a year-on-year increase of – 27.7%, and the average CIF price was US $327.28/ton, a year-on-year increase of – 7.1%. Oat hay is imported from Australia.
All imports of oat grass come from Australia. Affected by the expiration of the export license of Australian oat grass production plant and the preparation for the Spring Festival, oat grass traders increased the concentration of oat grass in Hong Kong in the first quarter. The import of oat grass began to decline in April, and the monthly import volume in May was the lowest since 2015. It is expected that China’s oat grass import will decline in 2021.
Figure 5 ‑ 3 China’s imports of oat hay 2020-2021
Unit: 10000 tons, USD / ton
Source: China Customs
More reading: Dairy economic observation: April 2021 China dairy trade monthly dairy economic observation: June 2021 China dairy economic monthly dairy economic observation: May 2021 China dairy trade monthly dairy economic observation: May 2021 China dairy economic monthly report may 2020 China dairy trade monthly report dairy economic observation: March 2020 China dairy trade monthly report dairy economy Observation: May 2020 China dairy economic monthly report dairy economic observation: April 2021 China dairy economic monthly report December 2020 China dairy trade monthly report November 2020 China dairy trade Monthly Report October 2020 dairy economic observation: January 2021 China dairy economic monthly report hacker one: the income of top white hats is 2.7 times that of software engineers Nielsen: global consumer Consumers consume 374 billion US dollars of snacks every year. Chinese people eat snacks. Self reward Deloitte: report on health care forecast in 2020 (attached)
If you want to get the full report, you can contact us by leaving us the comment. If you think the information here might be helpful to others, please actively share it. If you want others to see your attitude towards this report, please actively comment and discuss it. Please stay tuned to us, we will keep updating as much as possible to record future development trends.
RecordTrend.com is a website that focuses on future technologies, markets and user trends. We are responsible for collecting the latest research data, authority data, industry research and analysis reports. We are committed to becoming a data and report sharing platform for professionals and decision makers. We look forward to working with you to record the development trends of today’s economy, technology, industrial chain and business model.Welcome to follow, comment and bookmark us, and hope to share the future with you, and look forward to your success with our help.


