China’s energy production in April 2021 From National Bureau of Statistics
The following is the China’s energy production in April 2021 From National Bureau of Statistics recommended by recordtrend.com. And this article belongs to the classification: Chinese economy, New energy industry.
four In June, the production of raw coal in large-scale industries decreased, the production of crude oil and natural gas increased steadily, and the production of electric power increased rapidly. with two thousand and nineteen year four The average growth of raw coal, crude oil and electric power production in two years is stable, while the growth of natural gas production is fast.
1、 Production and related situation of raw coal, crude oil and natural gas
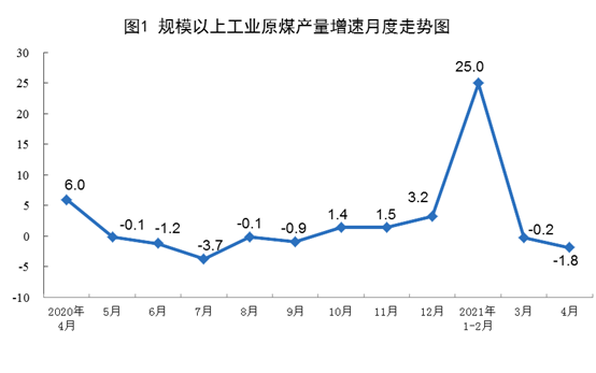
Raw coal production has declined. four Production of raw coal three point two 100 million tons, a year-on-year decrease 8% vs two thousand and nineteen year four Monthly growth 0%, with an average growth of 2 years 0% per day one thousand and seventy-four 10000 tons; Import coal two thousand one hundred and seventy-three Million tons, a year-on-year decrease 29.8%。
1—4 Production of raw coal twelve point nine 100 million tons, a year-on-year increase 11.1% vs two thousand and nineteen year 1—4 Monthly growth 12.5%, an average growth in two years 6.1%; Import coal nine thousand and thirteen Million tons, a year-on-year decrease 28.8%。
The comprehensive trading price of port coal continued to rise. four month thirty Qinhuangdao port, Japan 5500、5000 and four thousand and five hundred The price of coal in kcal is per ton six hundred and ninety Yuan, 618 yuan Yuan, 549 yuan Yuan, more than four month two They rose on the third day fifty-six Yuan, 51 Yuanhe forty-seven Yuan.
Crude oil production is stable and processing capacity keeps growing. four Production of crude oil one thousand six hundred and forty-one Million tons, a year-on-year increase 4% vs two thousand and nineteen year four Monthly growth 3%, with an average growth of 2 years 1% per day fifty-four point seven Ten thousand tons. Processing crude oil five thousand seven hundred and ninety Million tons, a year-on-year increase 5% vs two thousand and nineteen year four Monthly growth 3%, with an average growth of 2 years 1%, daily average processing one hundred and ninety-three Ten thousand tons.
1—4 Production of crude oil six thousand five hundred and sixty-three Million tons, a year-on-year increase 9% vs two thousand and nineteen year 1—4 Monthly growth 9%, with an average growth of 2 years 1.9%; Processing crude oil twenty-three thousand two hundred and ten Million tons, a year-on-year increase 14.2% vs two thousand and nineteen year 1—4 Monthly growth 10.3%, an average growth in two years 5.0%。
The import of crude oil has changed from up to down, and the international crude oil price has increased. four January, import crude oil four thousand and thirty-six Million tons, a year-on-year decrease 0.2%; 1—4 January, import crude oil seventeen thousand nine hundred and fifty-eight Million tons, a year-on-year increase 7.2%。 four month thirty The spot price of Brent crude oil in Japan is sixty-seven point seven three dollar / Bucket, by the way three month thirty-one Japanese sixty-three point five two dollar / Barrel up 6.6%。
Natural gas production has maintained steady growth. four Production of natural gas one hundred and sixty-nine Billion cubic meters, a year-on-year increase 0% vs two thousand and nineteen year four Monthly growth 3%, with an average growth in two years 10.6%, Nissan five point six 100 million cubic meters.
1—4 Production of natural gas seven hundred and two Billion cubic meters, a year-on-year increase 11.6% vs two thousand and nineteen year 1—4 Monthly growth 23.1%, with an average growth of two years 10.9%。
The growth rate of natural gas imports accelerated. four Import of natural gas one thousand and fifteen Million tons, a year-on-year increase 31.4%。 1—4 Import of natural gas three thousand nine hundred and forty-six Million tons, a year-on-year increase 22.4%。
2、 Electricity production
Electricity production grew rapidly. four In January, power generation six thousand two hundred and thirty 100 million kwh, a year-on-year increase 11.0% vs two thousand and nineteen year four Monthly growth 11.3%, an average growth in two years 5%, daily average power generation two hundred and seven point seven 100 million kilowatt hours. 1—4 In January, power generation twenty-five thousand two hundred and seventy-six 100 million kwh, a year-on-year increase 16.8% vs two thousand and nineteen year 1—4 Monthly growth 10.9%, with an average growth of two years 5.3%。
In terms of varieties, 4 In June, thermal power, hydropower, nuclear power and wind power maintained growth, while the growth rate of solar power generation declined. Among them, thermal power increased year on year 12.5%, with an average of 1 two thousand and nineteen year four Month is the base period, with an average growth of two years 6.7%; Hydropower growth 3%, an average decline in two years 3.1%; Nuclear power growth 2%, with an average growth of 2 years 7.9%; Wind power growth 1%, with an average growth of 2 years 10.7%; The decline of solar power generation 4%, with an average growth of 2 years 2.5%。
Read more: National Bureau of Statistics: energy production in April 2020 National Bureau of Statistics: energy production in December 2018 National Bureau of Statistics: energy production in December 2020 National Bureau of Statistics: energy production in March 2021 National Bureau of Statistics: energy production in October 2020 National Bureau of Statistics: energy production in May 2020 China Bureau of Statistics: March 2019 National Bureau of Statistics: investment and sales of real estate development in China from January to may 2020 National Bureau of Statistics: total retail sales of social consumer goods in April 2020 decreased by 7.5% National Bureau of Statistics: total retail sales of social consumer goods increased by 8.4% in the first half of 2019 National Bureau of Statistics: investment and sales of real estate development in China from January to October 2020 National Bureau of Statistics: January to March 2021 National Bureau of Statistics: China’s consumer goods market from January to February 2013 National Bureau of Statistics: the total retail sales of social consumer goods in December 2020 will increase by 4.6% National Bureau of Statistics: China’s real estate development investment and sales from January to December 2020
If you want to get the full report, you can contact us by leaving us the comment. If you think the information here might be helpful to others, please actively share it. If you want others to see your attitude towards this report, please actively comment and discuss it. Please stay tuned to us, we will keep updating as much as possible to record future development trends.
RecordTrend.com is a website that focuses on future technologies, markets and user trends. We are responsible for collecting the latest research data, authority data, industry research and analysis reports. We are committed to becoming a data and report sharing platform for professionals and decision makers. We look forward to working with you to record the development trends of today’s economy, technology, industrial chain and business model.Welcome to follow, comment and bookmark us, and hope to share the future with you, and look forward to your success with our help.


