Changes and characteristics of domestic air passenger flow under the influence of epidemic situation From China Tourism Research Institute
The following is the Changes and characteristics of domestic air passenger flow under the influence of epidemic situation From China Tourism Research Institute recommended by recordtrend.com. And this article belongs to the classification: Travel reservation.
With the continuous improvement of people’s living standards, air travel has become a very popular mode of transportation. With the promotion of economic development and urbanization, the annual air passenger traffic has increased significantly, and air travel has become the first choice for people’s medium and long-distance travel. However, the outbreak of the epidemic in 2020 impacted the national air passenger transport market, halved the scale of the domestic demand side market throughout the year, and repeated regional epidemics led to significant changes in market volatility. With the opening of inter provincial tourism in the third quarter, the air passenger transport market gradually recovered, showing a ladder upward trend. Under the background of the double cycle pattern of normalization of the epidemic situation, the dividend in the domestic travel market has been accelerated, and a new air transportation development pattern dominated by the domestic market and promoted by both domestic and foreign countries has been formed. The release of this report is the recovery of the domestic market, excluding Hong Kong, Macao, Taiwan and international passenger transport data.
1、 Overall situation of domestic air passenger transport market
(1) Current situation of civil aviation passenger transport scale
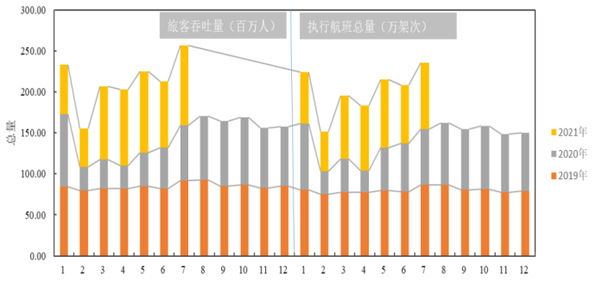
Under the influence of COVID-19 in 2020, the annual passenger throughput of domestic airports totaled 723 million passengers, down 41.1% from the same period in 2019, and the total number of flights held 7 million 242 thousand and 200 sorties, down 32.6% from the same period last year. The national passenger transport market gradually rebounded from the fourth quarter of 2020. From January to July 2021, the overall passenger throughput of national airports recovered to 96.4% in the same period of 19 years, and the total number of flights recovered to 90.4%. Since March, it has maintained a high growth, exceeding the level of the same period before the epidemic. The domestic tourism cycle promotes the rapid recovery of the domestic aviation market.
Figure 1 passenger throughput and total number of flights performed at international airport from 2019 to 2021
(data source: calculated by OAG data)
(2) The recovery of regional market is fast in the East and slow in the West
In 2020, the domestic passenger throughput of all regions will decrease by an average of 30.24% compared with 2019, of which the northwest region will decrease the most, up to 37.33%. From January to July 2021, the passenger throughput in all regions basically recovered to more than 90% in the same period of 2019, and the recovery in Central China is relatively optimistic, exceeding 38% in the same period of 2019. In 2021, the ranking of airport passenger throughput in various regions is: East China > Southwest > South China > Northwest > Central China > Northeast.
Figure 2 changes in passenger throughput of various regions from 2019 to 2021
(data source: calculated by OAG data)
(3) Market recovery in major cities in China
In 2021, there were 235 civil airports in China. From January to July 2021, there were 18 airports with a passenger throughput of more than 10 million, accounting for 55.38% of the passenger throughput in July. The passenger throughput of Beijing, Shanghai and Guangzhou airports accounted for 24.9% of the total. Compared with the passenger throughput of airports in 2019 and 2020, the top ten airports have not changed, only slightly increased or decreased in ranking. Among them, Beijing dropped 3 places and Shenzhen rose to the second place, further narrowing the gap with Guangzhou Baiyun Airport. Guangdong Hong Kong Macao Dawan airport is in the top two and has great market potential. Affected by the epidemic, Hubei dropped to 23.
Table 1 ranking of passenger throughput of national airports in 2019 and 2020 (unit: 10000 people)
(data source: OAG data)
At present, the average recovery rate of national passenger throughput is 95.14%. Compared with the same period before the epidemic, most provinces and cities have not recovered to the epidemic level. At present, a total of 9 provinces and autonomous regions have recovered or even exceeded the same period before the epidemic. The recovery degree of Southwest China is good, and the recovery of North China market is relatively slow.
Figure 3 provincial recovery rate in 2021 compared with 2019 (data source: calculated by OAG data)
(4) Market recovery time
1. Hubei Province is seriously affected by the epidemic, and the recovery time is about 6 months after the end of the phased epidemic
In terms of market recovery time, Wuhan will be closed at the end of January 2020, the country will enter a wartime state, all kinds of tourism activities will be stopped, and flights will be cancelled in a large area. In February, the flight cancellation rate in Hubei Province reached 98.04%, and the number of flights decreased by 97.9% compared with the same period. It began to recover slowly in March, recovered to 78.8% in the same period in 2019 in August, and the cancellation rate decreased to 4.72%. The overall recovery time was 6 months.
Figure 4 total number and cancellation rate of flights in Hubei Province from 2020 to 2021 (data source: calculated by OAG data)
2. The recovery time of sporadic and multi-point epidemic situation generally follows the fluctuation of epidemic situation, and the recovery time shall not exceed 1 month after the end of phased epidemic situation
Since August 2020, sporadic outbreaks have occurred in 80 counties and cities (districts) in 25 provinces. Select four areas with epidemic duration of more than 15 days in Beijing, Shanghai, Jilin and Xinjiang to observe the flight recovery. It can be seen from the figure that during the duration of the epidemic, the number of flight cancellations increased significantly. With the end of the epidemic, the flights gradually returned to the previous level. According to comprehensive observation, the recovery time was no more than 1 month.
Figure 5 total number and cancellation rate of flights in Beijing from 2020 to 2021 (data source: calculated by OAG data)
Figure 6 total number and cancellation rate of flights in Shanghai from 2020 to 2021 (data source: calculated by OAG data)
Figure 7 total number and cancellation rate of flights in Jilin Province from 2020 to 2021 (data source: calculated by OAG data)
Figure 8 total number and cancellation rate of flights in Xinjiang Uygur Autonomous Region from 2020 to 2021 (data source: calculated by OAG data)
2、 Characteristics of domestic air passenger transport market
(1) The regional market capacity has picked up steadily, and the northern route resources have been fully utilized
From January to July 2021, the average seating rate of inbound and outbound flights in China was 55.3%, an increase of 7.3 percentage points over 2020 and restored to 86.4% in 2019. The inbound and outbound passenger seat rate of each region is high in the north and low in the south, and the outbound passenger seat rate is higher than the inbound passenger seat rate on average.
In terms of regional distribution, the northeast and northwest regions account for a large proportion of intra regional flights and have the highest seating rate, with an average seating rate of 63.1% and 57.6%. Central China has the lowest seating rate, only 46.4%.
From the perspective of recovery, the overall recovery in 2021 will be 86% before the epidemic. The recovery degree in the north is generally higher than that in the south, the recovery in the northeast and North China is better, and it will recover to more than 90% in 2019, followed by the northwest and East China. The recovery degree is higher than the average, and the recovery in the southwest and central China is relatively slow.
The routes with the highest occupancy rate are: Heilongjiang → Liaoning, Shandong, Liaoning → Beijing, Tianjin, Shanghai, Hainan inbound flights in March, April and may, routes in Inner Mongolia Autonomous Region and flights from Shanghai Hongqiao Airport to all parts of the country in March, April and may.
Figure 9 capacity of domestic air passenger transport market (data source: calculated by OAG data)
(2) The change of domestic routes shows rising in the South and falling in the north
China’s domestic routes are concentrated in the east of the – Beijing – Xi’an – Chengdu – Kunming line. Relying on the advantages of world-class airport clusters in Beijing Tianjin Hebei, Yangtze River Delta and Guangdong, Hong Kong and Macao Bay areas, East, North and South China have a wide coverage and high share of routes. Southwest China takes Sichuan and Yunnan provinces as the core, and the routes radiate all over the country. There are relatively few routes in Central China and Northwest China, and the least in Northeast China. On the whole, the route density gradually decreases from east to west.
As of July 2021, the number of direct routes across the country has increased by 2% compared with 2019 and decreased slightly compared with 2020. The growth rate in Southwest China is relatively large, an increase of 18.9% over 2019, and the increase in Sichuan and Yunnan is obvious. Routes in North and South China were significantly reduced, down 1.61% and 8.5% compared with 2019. Affected by the epidemic control, routes in Beijing and Guangzhou decreased significantly.
In terms of route distribution density, the Yangtze River Delta has strong adsorption capacity, forming a trend of taking the Yangtze River Delta as the core and spreading to all regions. The route density between East China, South China and southwest is relatively high, and the route density in the north and West is relatively uniform. Each region takes its core cities as the center and spreads to all regions, including Beijing, Shanghai, Guangzhou, Sichuan, Shandong, Yunnan Zhejiang has an obvious core position. Inner Mongolia and Xinjiang have a vast territory and dense routes in the province.
Figure 10 routes in domestic air passenger transport market (data source: calculated by OAG data)
(3) The number of inter provincial flights increased compared with the share of intra provincial flights
The development of China’s airline market affects the inter provincial airline market to a certain extent. The number of inter provincial passengers in 2020 decreased by 28.3 percentage points compared with 2019. From January to July 2021, it recovered to 99.3% in the same period before the epidemic, and the proportion of inter provincial passengers increased slightly compared with that before the epidemic. The number of inter provincial passengers among regions shows a trend of divergence in the East and contraction in the West. The suction and thrust of North China are obvious, and the number of inter provincial passengers in the western region is large. First tier cities are still the main destinations, and the top ten inbound flights are Guangzhou Baiyun, Chengdu Shuangliu, Shenzhen Bao’an, Shanghai Hongqiao, Chongqing Jiangbei, Xi’an Xianyang, Shanghai Pudong, Hangzhou Xiaoshan and Beijing Daxing airport.
Table 2 Comparison of inbound and outbound passengers in regional markets
(data source: OAG data)
Table 3 ranking of inbound and outbound passengers in each airport market in China (unit: 10000)
(data source: OAG data)
(4) The holiday market shows a ladder upward trend
In 2020, the number of tourists on Qingming and May Day holidays will be greatly affected by the epidemic, and the number of holiday tourists will rise slowly. The epidemic situation in 2020 did not affect the passenger transport during the Spring Festival, and the number of passengers sent across the country increased by 0.04% compared with the same period in 2019. Affected by the epidemic this year, all localities advocated local New Year celebrations, and the number of passengers sent across the country decreased by 0.29% compared with 2020.
Figure 11 proportion of Spring Festival and may day passenger volume from 2019 to 2021 (data source: calculated by OAG data)
In 2021, the number of holiday passengers returned to a step-by-step upward trend. During May Day, it returned to 115% of the same period before the epidemic, an increase of about 178% compared with 2020.
Figure 12 passenger throughput recovery of domestic airports from January to July 2019 and 2021 (data source: calculated by OAG data)
Popular holiday destinations shifted to second and third tier cities, and the net inflow ranking of Kunming, Hangzhou, Qingdao, Urumqi and other places increased significantly.
Table 4 ranking of net inflow of destination airports in October 2020
(data source: OAG data)
Table 5 ranking of net inflow of destination airports from January to February 2021 (unit: person time)
(data source: OAG data)
Table 6 ranking of net inflow of destination airports from April to may 2021
(data source: OAG data)
Summary:
1. Under the background of internal circulation, China’s domestic aviation market recovered well, and the passenger volume in July exceeded the level of the epidemic in the same period, releasing a positive signal. Under the normalization of the epidemic, the recovery of passengers’ willingness to travel will further expand the market capacity and accelerate the recovery of the market.
2. The market in East China relies on the airport group in the Yangtze River Delta and is highly active. With the strong economic hinterland of Guangdong, Hong Kong and Macao, Shenzhen Bao’an airport has a rapid increase in passenger traffic and great demand potential.
3. The epidemic affects public travel modes and travel choices. The rise of individual tourists and self driving travel has led to the contraction of air passenger volume in the province. The future layout of the aviation market should take into account the substitutability of means of transport.
4. The choice of holiday destinations has shifted from cities to minority destinations. Emerging tourist destinations with good natural environment, low population density and strong regional characteristics have great market growth potential in the southwest and northwest regions.
Note: the above report was jointly completed by China Tourism Research Institute (data center of the Ministry of culture and Tourism) and OAG.
Author: Wu Yuhan
Source: China Tourism Research Institute
More reading: China Tourism Research Institute: 2014 top 20 of China Tourism Group airbnb & China Tourism Research Institute: 2017 sharing accommodation and Chinese family travel report China Tourism Research Institute & Google: 2019 analysis report on behavior and attitude of Chinese Inbound Tourists interpretation of China Tourism Research Institute & Ma honeycomb: Online Tourism asset index report for the second quarter of 2020 (download attached) China Tourism Research Institute: China tourism scenic spot development report 2020 China Tourism Research Institute: 2020 China ice and snow tourism development China Tourism Research Institute & wasp nest: Online Tourism asset index (TPI) in the first half of 2021 Report: hornet’s Nest & China Tourism Research Institute: 2019 global free travel report China Tourism Research Institute: 2019 annual report on China’s outbound tourism development hornet’s Nest & China Tourism Research Institute: 2018 North China Tourism Report Beijing fever increased by 191%. China Tourism Research Institute: China received 141 million inbound tourists in 2018, a year-on-year increase of 1.2%. China Tourism Research Institute: 2019 night tourism Market data report China Tourism Research Institute & Google: 2019 analysis report on the behavior and attitude of Chinese Inbound Tourists China Tourism Research Institute: 2019 report on China’s nighttime economic development (with download) China Tourism Research Institute: 43.254 million people traveled during the Qingming holiday in 2020, a year-on-year decrease of 61.4%
If you want to get the full report, you can contact us by leaving us the comment. If you think the information here might be helpful to others, please actively share it. If you want others to see your attitude towards this report, please actively comment and discuss it. Please stay tuned to us, we will keep updating as much as possible to record future development trends.
RecordTrend.com is a website that focuses on future technologies, markets and user trends. We are responsible for collecting the latest research data, authority data, industry research and analysis reports. We are committed to becoming a data and report sharing platform for professionals and decision makers. We look forward to working with you to record the development trends of today’s economy, technology, industrial chain and business model.Welcome to follow, comment and bookmark us, and hope to share the future with you, and look forward to your success with our help.


